Customer success
Churn is a lagging indicator
By the time it is in your churn report, the decision was made months ago. Here is where it was actually made.
4 min read
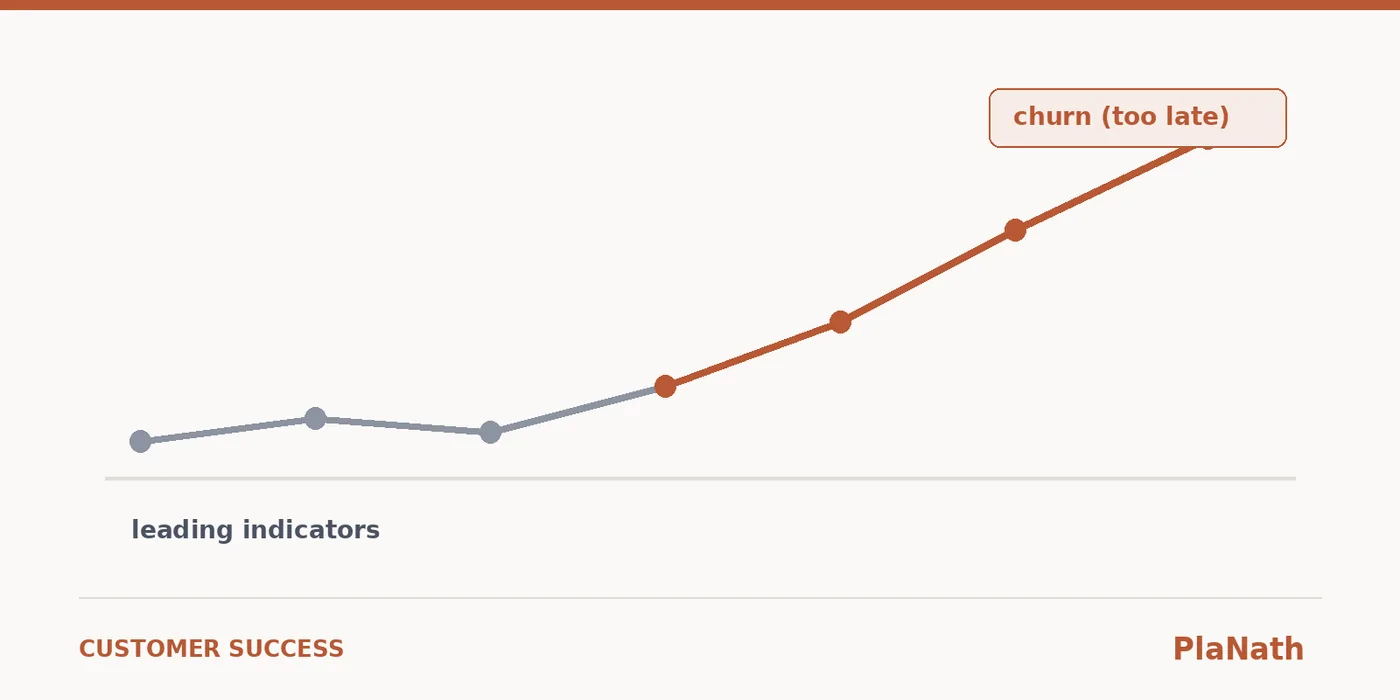
Your churn report tells you which customers left. It is accurate, it is useful for forecasting, and it is completely useless for prevention, because by the time a customer appears on it the decision was made somewhere between three and nine months earlier.
Managing retention from a churn report is like steering a car by looking at the road behind you. You will have excellent information about where you have already been.
Where the decision actually gets made
Renewal decisions are rarely a single moment. They accumulate.
A customer has an experience that costs them internal credibility — they championed you, something went wrong publicly, and they had to explain it. That is the decision starting. It may take two more incidents over five months before it is conscious, and by then it is not really reversible through a good QBR.
This is why the most dangerous accounts are frequently not the loudest ones. A customer who escalates is a customer who still believes complaining will change something. A customer who has stopped escalating has often stopped believing that.
Five indicators that precede churn
Escalation resolution time trending up. Not the count. Customers tolerate problems; they do not tolerate problems that take longer each time. A rising resolution curve for one customer is one of the strongest signals available, and almost nobody measures it per-customer.
The champion goes quiet, and someone else appears. Contact shifting from your sponsor to a delegate is frequently the sponsor disengaging. Sometimes it is a promotion. Either way you need to know within a week, not at the QBR.
Adoption plateaus below the plan. The customer bought five modules and uses two. This one sits in plain sight and gets rationalised for quarters at a time.
A reopened ticket. A ticket that was resolved and comes back is disproportionately damaging. It says the fix was wrong, which means the diagnosis was wrong, which the customer reads as not being understood. Track reopen rate per customer, not just overall.
Silence after a bad month. A customer who had three incidents in a month and then says nothing is not satisfied. They have stopped investing in the relationship.
The instrumentation problem
Read that list again and notice something: four of the five live in your support system, and none of them are visible to the person who owns the renewal.
Support systems measure themselves — first response, resolution time, CSAT, volume, all aggregated across all customers. Customer success systems measure usage and contact. The specific thing you need, which is the trajectory of one customer's experience across delivery and support together, is not the native output of either.
So it goes unmeasured, and instead you get a quarterly conversation in which someone says the account "feels a bit soft".
What to build instead
You do not need a data warehouse. You need three views:
- Per-customer escalation duration over time. Is this specific customer waiting longer than they used to?
- Per-customer reopen rate. Are we fixing things properly for them?
- Contact recency and shape. When did we last hear from them, and who from?
All three are simple queries. They are difficult only when the delivery record and the support record live in different systems with different ideas of what a customer is.
Where PlaNath fits
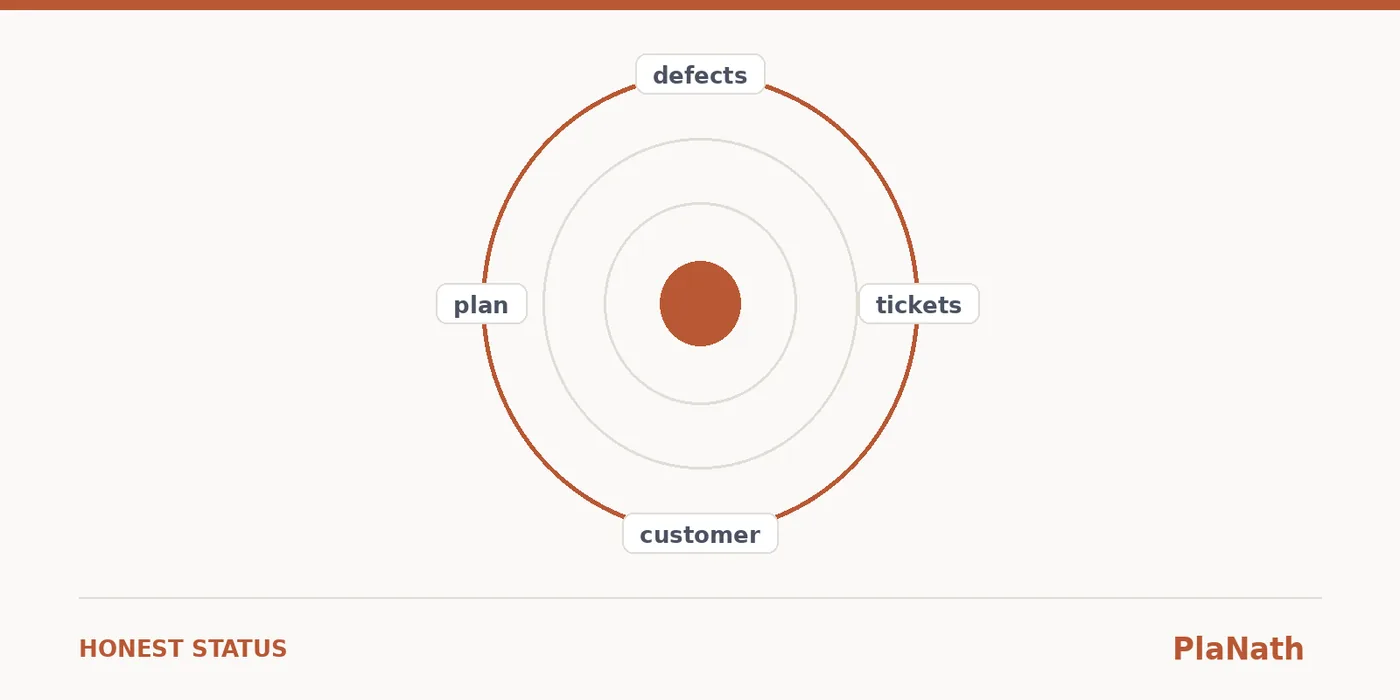
PlaNath holds support tickets, defects, escalations, projects and the customer record together, in one system, against one customer identity. That is not a reporting feature — it is the condition that makes these three views possible at all.
Churn will still happen. But it should not be the first time you find out.
PlaNath keeps support, delivery and the customer record in one system. planath.com
Start free trial